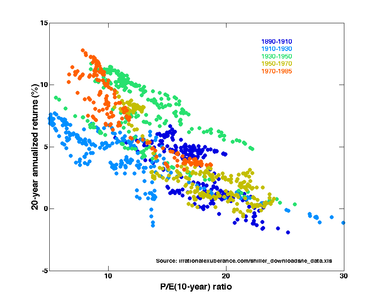
![Robert Shiller's plot of the S&P Composite Real Price Index, Earnings, Dividends, and Interest Rates, from Irrational Exuberance, 2d ed. In the preface to this edition, Shiller warns that "[t]he stock market has not come down to historical levels: the price-earnings ratio as I define it in this book is still, at this writing [2005], in the mid-20s, far higher than the historical average. … People still place too much confidence in the markets and have too strong a belief that paying attention to the gyrations in their investments will someday make them rich, and so they do not make conservative preparations for possible bad outcomes."](http://upload.wikimedia.org/wikipedia/commons/thumb/6/6f/IE_Real_SandP_Prices%2C_Earnings%2C_and_Dividends_1871-2006.png/380px-IE_Real_SandP_Prices%2C_Earnings%2C_and_Dividends_1871-2006.png)

A stock market crash is often defined as a sharp dip in share prices of equities listed on the stock exchanges. In parallel with various economic factors, a reason for stock market crashes is also due to panic. Often, stock market crashes end up with speculative economic bubbles.
There have been famous stock market crashes that have ended in the loss of billions of dollars and wealth destruction on a massive scale. An increasing number of people are involved in the stock market, especially since the social security and retirement plans are being increasingly privatized and linked to stocks and bonds and other elements of the market. There have been a number of famous stock market crashes like the Wall Street Crash of 1929, the stock market crash of 1973–4, the Black Monday of 1987, the Dot-com bubble of 2000. But those stock market crashes did not begin in 1929, or 1987. They actually started years or months before the crash really hit hard.
One of the most famous stock market crashes started October 24, 1929 on Black Thursday. The Dow Jones Industrial lost 50% during this stock market crash. It was the beginning of the Great Depression. Another famous crash took place on October 19, 1987 – Black Monday. On Black Monday itself, the Dow Jones fell by 22.6% after completing a 5 year continuous rise in share prices. This event not only shook the USA, but quickly spread across the world. Thus, by the end of October, stock exchanges in Australia lost 41.8%, Canada lost 22.5%, Hong Kong lost 45.8% and Great Britain lost 26.4%. Names “Black Monday” and “Black Tuesday” are also used for October 28-29,1929, which followed Terrible Thursday – starting day of the stock market crash in 1929. The crash in 1987 raised some mysticism – main news or events did not predict the catastrophe and visible reasons for the collapse were not identified. This event had put many important assumptions, of modern economics, under uncertainty, namely, the theory of rational conduct of human being, the theory of market equilibrium and the hypothesis of market efficiency. For some time after the crash, trading in stock exchanges worldwide was halted, since the exchange's computers did not perform well owing to enormous quantity of trades being received at one time. This halt in trading allowed the Federal Reserve system and central banks of other countries to take measures to control the spreading of worldwide financial crisis. In the United States the SEC introduced several new measures of control into the stock market in an attempt to prevent a re-occurrence of the events of Black Monday. Computer systems were upgraded in the stock exchanges to handle larger trading volumes in a more accurate and controlled manner. The SEC modified the margin requirements in an attempt to lower the volatility of common stocks, stock options and the futures market. The New York Stock Exchange and the Chicago Mercantile Exchange introduced the concept of a circuit breaker. The circuit breaker halts trading if the Dow declines a prescribed number of points for a prescribed amount of time.


No comments:
Post a Comment