To clearly distinguish the market price of shares from the core ownership equity or shareholders' equity, the term 'book value' is often used since it focuses on the values that have been added and subtracted in the accounting books of a business (assets - liabilities). The term is also used to distinguish between the market price of any asset and its accounting value which depends more on historical cost and depreciation. It may be used interchangeably with carrying value. While it can be used to refer to the business' total equity, it is most often used:
- as a 'per share' value': The balance sheet Equity value is divided by the number of shares outstanding at the date of the balance sheet (not the average o/s in the period).
- as a 'diluted per share value': The Equity is bumped up by the exercise price of the options, warrants or preferred shares. Then it is divided by the number of shares that has been increased by those added.
Uses
- Book value is used in the financial ratio price/book. It is a valuation metric that sets the floor for stock prices under a worst-case scenario. When a business is liquidated, the book value is what may be left over for the owners after all the debts are paid. Paying only a price/book = 1 means the investor will get all his investment back. Shares of capital intensive industries trade at lower price/book ratios because they generate lower earnings per dollar of assets. Business depending on human capital will generate higher earnings per dollar of assets, so will trade at higher price/book ratios.
- Book value per share can be used to generate a measure of comprehensive earnings, when the opening and closing values are reconciled. BookValuePerShare, beginning of year - Dividends + ShareIssuePremium + Comprehensive EPS = BookValuePerShare, end of year.
Changes are caused by
- The sale of shares/units by the business increases the total book value. Book/sh will increase if the additional shares are issued at a price higher than the pre-existing book/sh.
- The purchase of its own shares by the business will decrease total book value. Book/sh will decrease if more is paid for them than was received when originally issued (pre-existing book/sh).
- Dividends paid out will decrease book value and book/sh.
- Comprehensive earnings/losses will increase/decrease book value and book/sh. Comprehensive earnings, in this case, includes net income from the Income Statement, foreign exchange translation changes to Balance Sheet items, accounting changes applied retroactively, and the opportunity cost of options exercised.
New share issues and dilution
The issue of more shares does not necessarily decrease the value of the current owner. While it is correct that when the number of shares is doubled the EPS will be cut in half, it is too simple to be the full story. It all depends on how much was paid for the new shares and what return the new capital earns once invested. See the discussion at stock dilution.
Net book value of long term assets
Book value is often used interchangeably with "net book value" or "carrying value", which is the original acquisition cost less accumulated depreciation, depletion or amortization.


 , where
 .
. .
. ,
,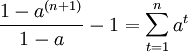 .
.![P_n = D \times \left[ \frac{1-a^{(n+1)}}{1-a} - 1 \right]](http://upload.wikimedia.org/math/7/e/1/7e1dafbaf60b699fdcdcd3a62db46a73.png) .
. as
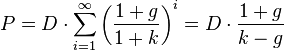
as ![P_\infty = D \times \left( \frac{1}{1-a} - 1 \right) = D \times \left( \frac{a}{1-a} \right) = D \times \left(\frac{1+g}{1+k}\right) / \left[ 1 - \left(\frac{1+g}{1+k}\right) \right] = D \times \left( \frac{1+g}{k-g} \right)](http://upload.wikimedia.org/math/1/b/a/1ba35ffe94c99a5fcd65b18482b59473.png) .
. .
. , In practice this P is then adjusted by various factors e.g. the size of the company.
 , k denotes expected return = yield + expected growth.
 .
.